

Artifact of Occurrences
Request Now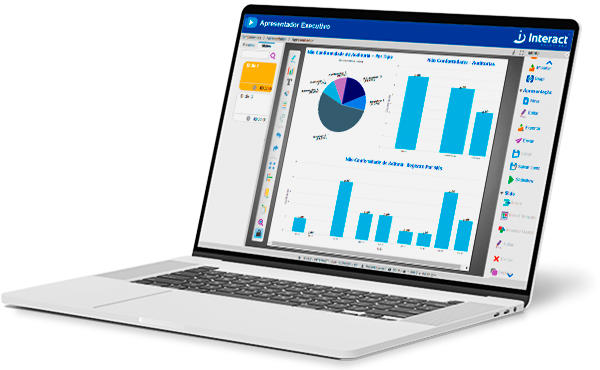
The artifact consists of the graphical or analytical visualization of data customized for each client according to their needs. The tool shows how many events are recorded at each stage of a specific type of occurrence. Additionally, it allows the comparison of how many occurrences are allocated in each sector and the quantity recorded each month.
The visualization can be customized according to the chosen period or defined areas. In the artifacts, a title and its colors must also be established. It is also necessary to define the mnemonic of the field and the type of occurrences to be presented. It is possible to change the colors, the font size of the main title and the X and Y axes, as well as to define the rotation of the values presented in the graph, as well as align and position the legend.