Customize your experience with Interact’s software

Explore the infinite analytical possibilities and discover how our services can elevate your business performance. Project development, customizations, and analyses that align with your needs.

Our team is ready to meet the specific demands of your business.

Interact has a specialized team dedicated to developing projects, customizations, and analytical needs for its clients.

Discover the services we offer to make your experience with our software even better.
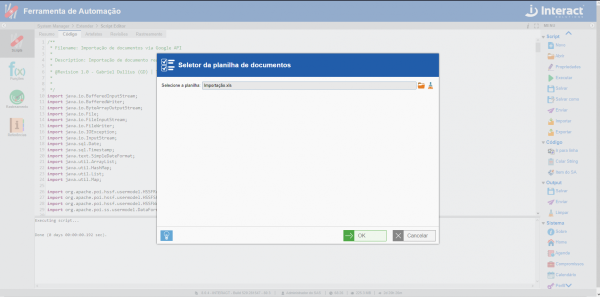
Project Development

Dashboard

Risk Dashboard

Created with Microsoft's PowerBI technology and fully integrated into the SA Suite, the risk dashboard allows for quick and practical visualization and analysis of information from the Risk Manager module. With it, you can: - Count the quantity of risks and controls per process structure; - Evaluate the risk levels of each process; - Assess the classifications of controls; - Compare the situation of risks or processes between two different baselines; - Visualize the entire risk structure of the module on one screen. This BI dashboard aims to consolidate the structure of the risk module into an analytical and graphical view, enabling an assessment of all the structure registered in the module, with an analysis of risk levels, impacts, and probabilities. Assisting in decision-making and managing processes and their risks.

Dashboard

Model Dashboard for Indicators

A BI analysis seeks to consolidate different pieces of information in just one place, with a well-defined layout and objectives to facilitate the gathering of information and decision-making for those evaluating your data. Interact already offers various customized dashboards for its clients, presenting information from different modules or integrating with other systems. Leveraging the entire Power BI technology for implementation and deployment. However, in this specific case, we offer the indicator model dashboard as a more configurable solution for clients. With a pre-defined layout and a customization screen, the client can duplicate this dashboard and configure each visualization with the desired indicators. Providing more autonomy to system users, in addition to making the dashboard more accessible. In the video below, you can check all the information that the dashboard can offer you. If interested, you can request a proposal to acquire this dashboard by clicking the "Request Now" button; from there, a ticket will be created, and we will contact you to align the details.

Dashboard

Satisfaction Survey Dashboard

Explore our Survey Manager dashboard, created with Microsoft's PowerBI technology. Fully integrated into the SA Suite, it allows you to visually and objectively analyze satisfaction survey results. Among its benefits are: - Objective visualization of which survey points require more attention; - Categorization of topics and information filtering for better interaction with the dashboard; - Pivot table; - Interaction between charts. In this way, we can see that this dashboard is a modern solution that facilitates the management, monitoring, and analysis of engagement surveys for each organization, optimizing decision-making, problem identification, and solutions.

Custom

Process Modeling and RPA (Ticket Management)

In addition to providing automated process modeling, the Process Manager enables a series of customizations and business rules to best meet each company's processes. In this example presented in the video, the query and registration of instances of the Ticket Management process can be done without the need for authentication in the system. Additionally, the solution demonstrated integration with Rocketbot, a partner of Interact specializing in robotic process automation (RPA). In this case, a robot was created to record incidents in SA autonomously based on information from the process instance. Interact offers a team of skilled professionals to model, integrate, and implement processes. These solutions have an effort cost for their development, which varies according to the requested complexity. However, Interact conducts requirements analysis with the client to best meet the needs of each one.

Custom

Process Modeling, RPA, and Digital Signature (Customer Onboarding)

In addition to providing automated process modeling, the Process Manager enables a series of customizations and business rules to best meet each company's process needs. In the example presented, we have the modeling of a Customer Onboarding process, with automatic generation of PDF documents, notification sending, digital signing of documents, and integration with Rocketbot, a tool specialized in robotic process automation (RPA) solutions. Together, the SA Process Manager and Rocketbot enable infinite automation solutions that can be adapted and implemented for any requirement. Interact offers a team of professionals trained to model, integrate, and implement processes. These solutions have a development effort cost, which varies according to the requested complexity. However, Interact conducts a requirements analysis with the client to best meet their needs.

Custom

Importation of Documents to SA via Google Drive and Storage Cloud

It is possible to import documents to SA that are published on Google Drive or in the Google Storage Cloud, such as spreadsheets, documents, presentations, and other files. The importation of documents to SA will be done via a customized script that will read a spreadsheet. In it, information such as code, name, category, version, and the link to the Google document can be provided (additional fields can be provided as needed). With this data, each line/document in the spreadsheet will be imported into the Document Manager. To consume the Google APIs, which allow access to documents and their download, it is necessary to have a Google Workspace account. Interact can use its own Google Workspace account when performing legacy imports (when the script is executed only by Interact technicians). If the client wishes to have the script in their environment for periodic execution, the client must provide the Google Workspace account.

Dashboard

Project Dashboard

Discover our Project Dashboard, created with Microsoft's PowerBI technology. Fully integrated into the SA Suite, it allows you to visually and objectively track the progress of your projects. Among the benefits of the Project Dashboard, you will have: Interaction between graphs. Filter by sponsor, manager, or supervisor in the Task graph, showing tasks under your responsibility. PDPI (Project Deadline Performance Index) to ensure project deadline compliance. PCPI (Project Cost Performance Index) to monitor the project's progress in relation to the planned budget. Customizable filters, both by month and year, and by portfolio, program, and project. Comparison by period and also by month, individually. This is the Project Dashboard. It provides us with all the necessary information for project management. Therefore, it is a modern solution that facilitates the management, monitoring, and analysis of tasks for each organization, optimizing decision-making, task completion, and adherence to costs and deadlines, as well as assisting in problem identification and solutions.

Artifact

Artifact of Occurrences

The artifact consists of the graphical or analytical visualization of data customized for each client according to their needs. The tool shows how many events are recorded at each stage of a specific type of occurrence. Additionally, it allows the comparison of how many occurrences are allocated in each sector and the quantity recorded each month. The visualization can be customized according to the chosen period or defined areas. In the artifacts, a title and its colors must also be established. It is also necessary to define the mnemonic of the field and the type of occurrences to be presented. It is possible to change the colors, the font size of the main title and the X and Y axes, as well as to define the rotation of the values presented in the graph, as well as align and position the legend.

Artifact

Project Artifact

The project artifact consists of the graphical or analytical visualization of data customized for each client according to their needs. It presents the current and ideal completion percentage for each project within the linked folder. The artifact also shows the total of these two values and their representation in a Gauge chart.

Dashboard

Occurrences Dashboard

The SA Occurrence Manager enables the integration of BI (Business Intelligence) dashboards created with Microsoft's Power BI, a business analytics service. The tool allows for the graphical and objective visualization of similar information from different types of occurrences with common custom fields. This way, users can analyze consolidated information from various different module forms, applying value filters to their fields. The tool also allows access to analyses in a comprehensive or individual manner. Additionally, it offers many other conveniences and functionalities: Interaction with graphs Drill-down of data in the Pivot Comparison of periods and filtering by months (individually) Filtering occurrences by responsible party Checking their status This dashboard is a modern solution that facilitates management. It helps monitor and analyze occurrences in each organization. With this, you can optimize decision-making in problem identification, focusing on solutions.

Custom

Project Report

Project reports are a customized overview presenting key task information within a project. There are two types of available reports. The first one shows the date when the report was generated, the start and end of the project and tasks, the completion percentage, the WBS (Work Breakdown Structure), and a pie chart indicating the status of each item. In addition to providing the same information as the previous one, the second type of available report also includes a task completion chart. The difference is that, in the listing, it indicates the duration of each task, the status, the ideal completion, the estimated budget, and the actual budget.

Dashboard

Indicators Dashboard

The SA Occurrence Manager allows the integration of BI (Business Intelligence) dashboards created with Microsoft's Power BI, a business analytics service. The tool enables the graphical and objective visualization of information about indicators, with interaction between graphs and drill-down data in the Pivot. Another advantage is the preparation of charts by unit, by department, and by user. In the graphs, it is possible to visualize performance by period (standard or customized), performances by unit, and accumulated for the period. You can compare between periods and also filter by month, indicator title, user, department, and unit. The indicators dashboard is a solution for high-performance managers, providing real-time monitoring and analysis of each organization or business unit. All of this will facilitate decision-making for the future of your company.

Custom

Managers and Users Agenda

Agenda is an application that allows each user to access their to-do list. In this customization, you can activate these tasks to be sent via email. This configuration is done through scripts, where it is also possible to define their periodicity. In the email, each user will receive a list of tasks in their agenda, and upon clicking on them, the system will display a checklist screen for the agenda items. It is also possible to send an email to each manager with the tasks of their subordinates, and upon clicking on one of them, direct them to the consolidated agenda of each one within the software. The definition of managers and subordinates is done through the Hierarchy view of the Collaborators application, part of the SA System Manager in the SA Suite.

Frequent Questions

Clarify some of the most common doubts about our products

  • Custom” or “customization” refers to requests originated by customers to meet a need that the Suite SA product does not currently provide. These could include new reports, queries, artifacts, dashboards, new screens, or specific functionalities requested by the customer. Any customization must be requested through a support ticket, either by the customer directly or by the customer’s consultant. Based on this request, an initial analysis is conducted, requirements are gathered, and the best solution or approach is defined to fulfill the request.

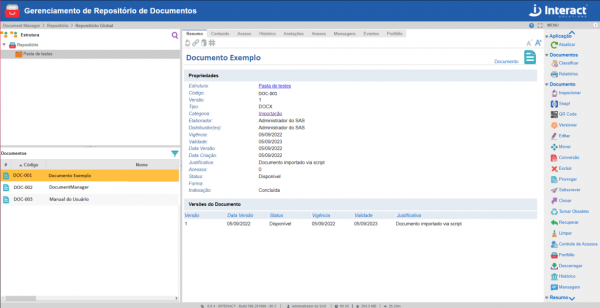
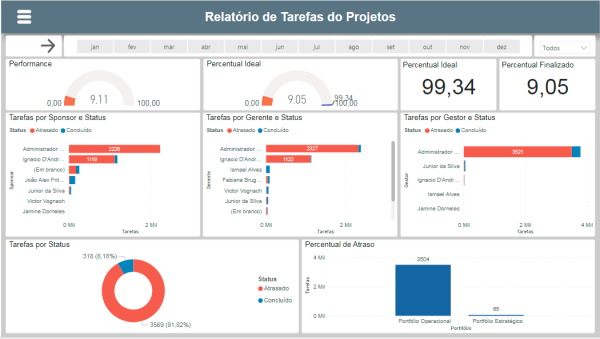
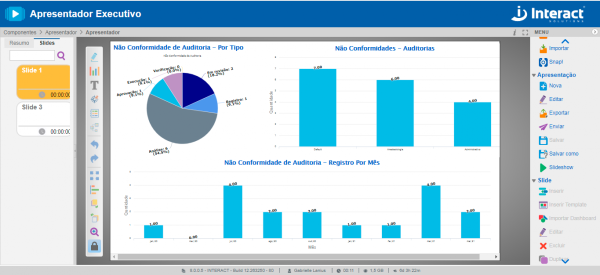
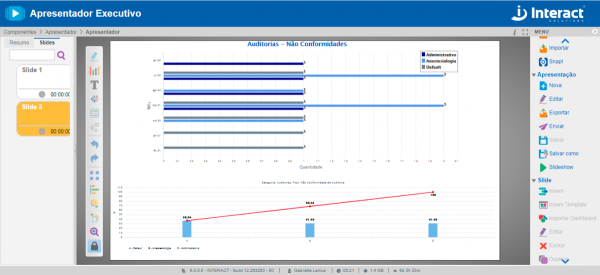
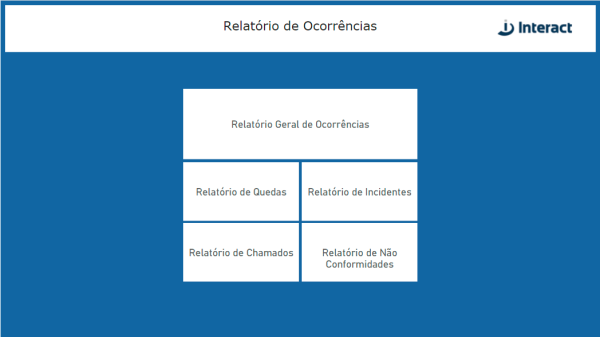
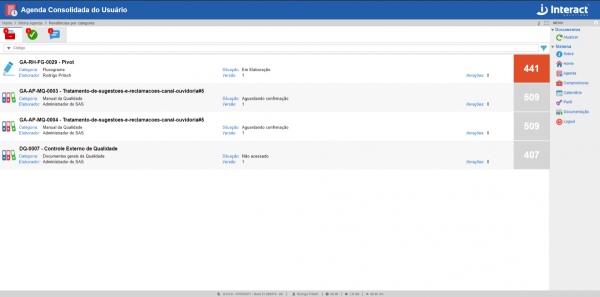
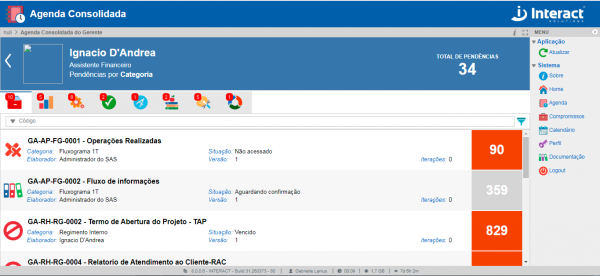
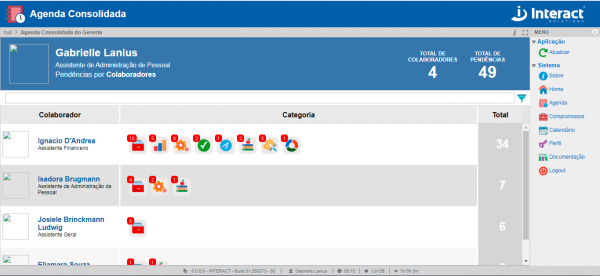
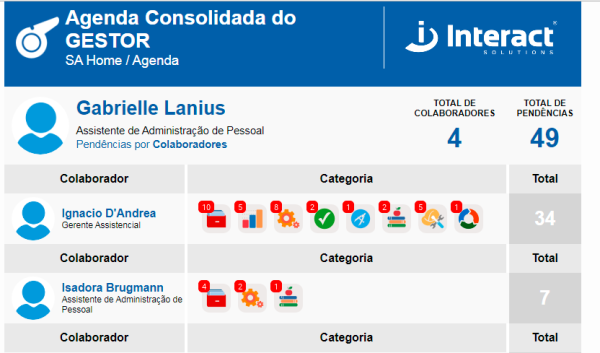
  • Artifact is a visual or analytical representation of data customized for each client, according to their needs.

    They can be one or more charts of different types, structured tables, cards, and other visual or interactive elements. Typically, artifacts are used in the Presenter or Dashboard applications. It is also possible to place them in summary tabs on SA inspector screens.

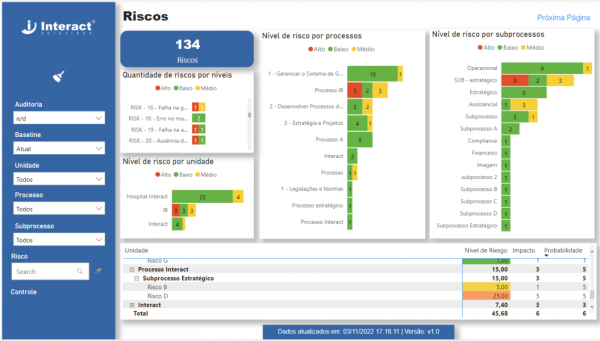
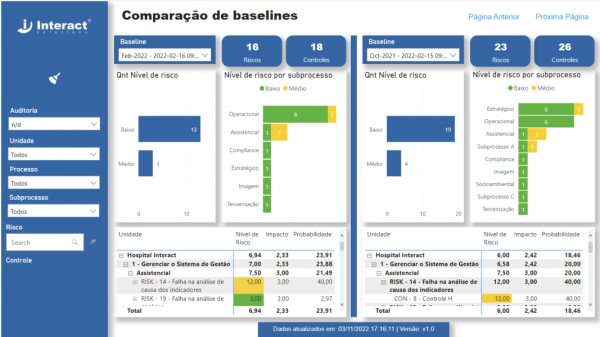
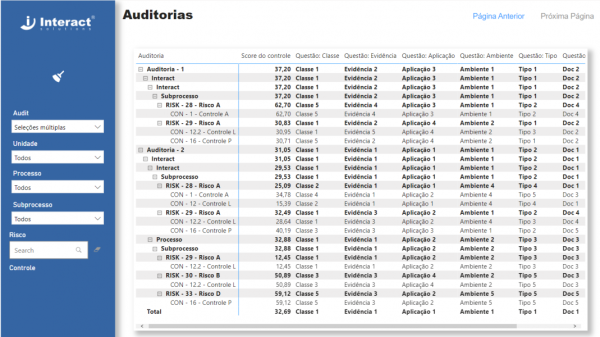
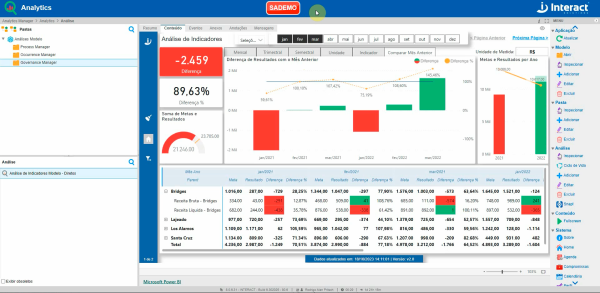
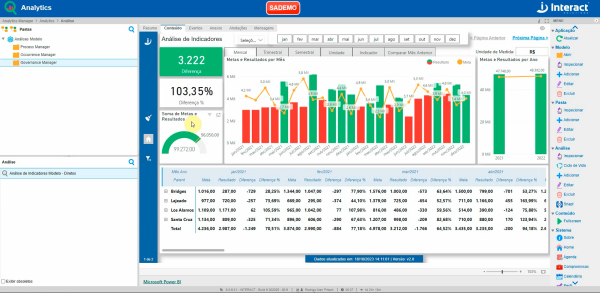
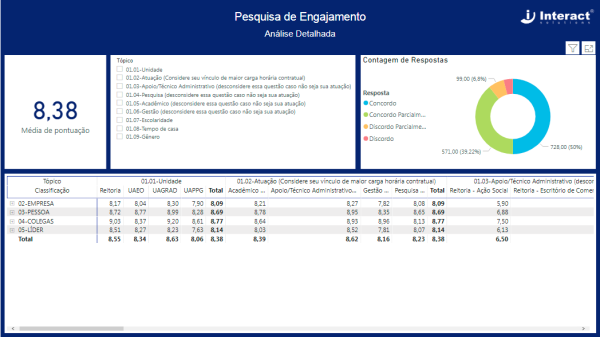
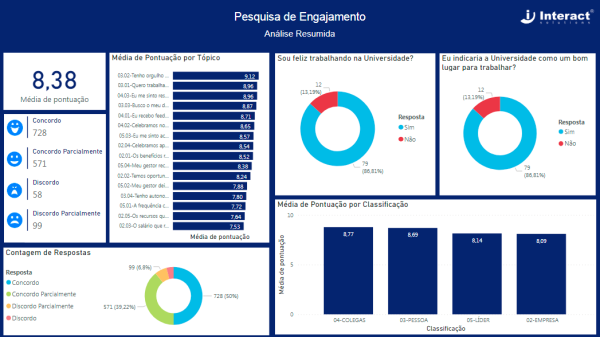
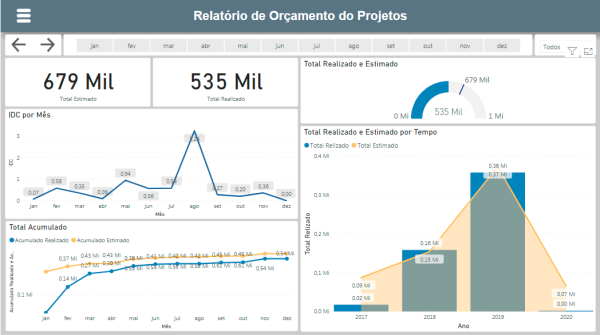
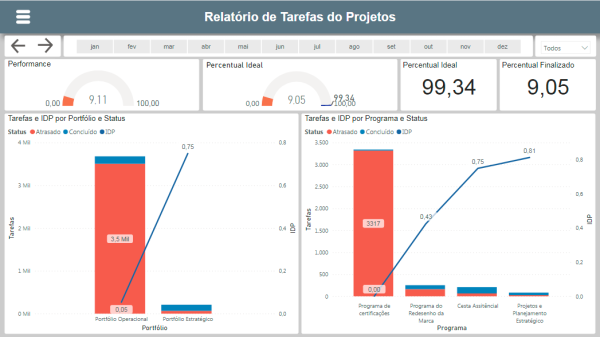
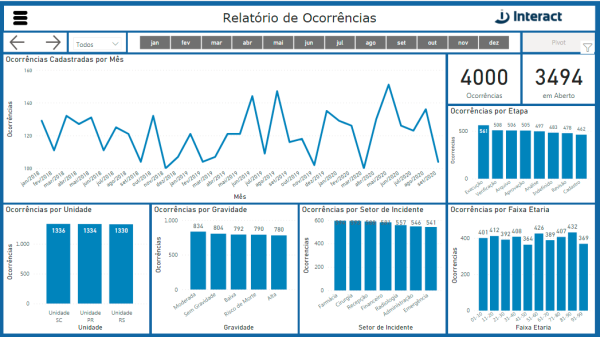
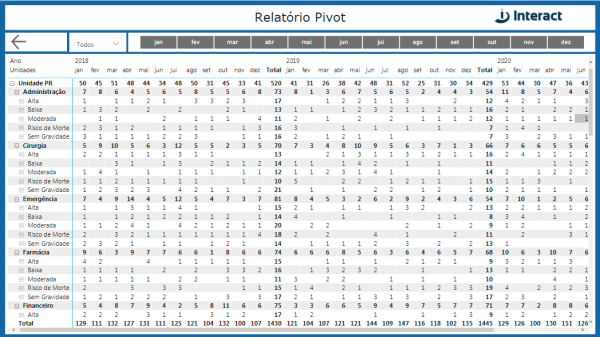
  • BI analysis is a dashboard available in the SA Analytics Manager module. The BI analyses used in SA are developed using Microsoft’s Power BI tool. Each analysis is created to meet the customer’s needs and can present information from SA itself or from other systems. BI analyses enable a highly effective integration of different information, along with a modern layout and endless possibilities for filtering and interaction among the processed data.

  • Yes, it is possible. In fact, this is one of the main reasons we gather requirements with the requester, always aiming to meet all needs.

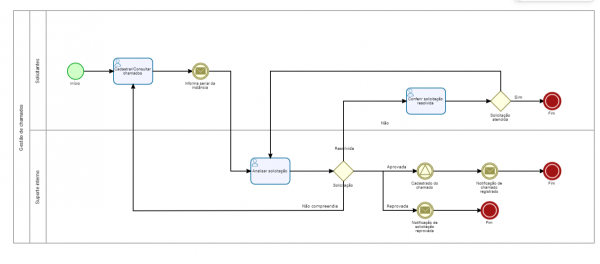
  • For these service and project customizations, Interact works with a Service Order process. Firstly, we will receive your request and get in touch with you to gather details, document requirements, and estimate effort. Then, we will send you the requirements documentation and the proposal for your approval. If you agree with the requirements and the proposal amount, we will schedule the delivery of the customization in your test environment, where you can validate it (confirm for us to deliver it to the SA production environment).

  • Yes, customizations, services, or projects have a development cost. Therefore, with each new request, an Interact technician will contact you to gather the requirements and document them for your approval. This way, we will ensure that we are meeting your needs in full, and it will also enable a more accurate estimate of the necessary effort and, consequently, the cost for the customer.

Still have questions
about our products?

Contact our team

Solutions for all companies

Get in touch and find out which is the best tool for your business.