

Indicators Dashboard
Request Now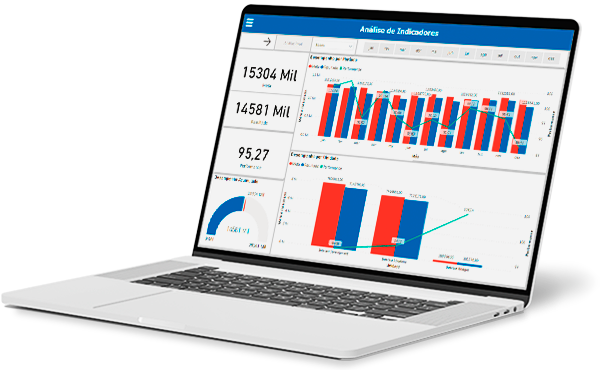
The SA Occurrence Manager allows the integration of BI (Business Intelligence) dashboards created with Microsoft’s Power BI, a business analytics service. The tool enables the graphical and objective visualization of information about indicators, with interaction between graphs and drill-down data in the Pivot.
Another advantage is the preparation of charts by unit, by department, and by user. In the graphs, it is possible to visualize performance by period (standard or customized), performances by unit, and accumulated for the period. You can compare between periods and also filter by month, indicator title, user, department, and unit.
The indicators dashboard is a solution for high-performance managers, providing real-time monitoring and analysis of each organization or business unit. All of this will facilitate decision-making for the future of your company.
Watch the demonstration video