

Satisfaction Survey Dashboard
Request Now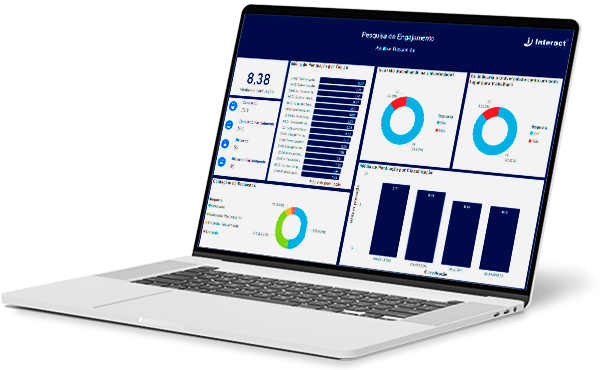
Explore our Survey Manager dashboard, created with Microsoft’s PowerBI technology. Fully integrated into the SA Suite, it allows you to visually and objectively analyze satisfaction survey results.
Among its benefits are:
– Objective visualization of which survey points require more attention;
– Categorization of topics and information filtering for better interaction with the dashboard;
– Pivot table;
– Interaction between charts.
In this way, we can see that this dashboard is a modern solution that facilitates the management, monitoring, and analysis of engagement surveys for each organization, optimizing decision-making, problem identification, and solutions.
Watch the demonstration video